|
|
||
|---|---|---|
| .github/workflows | ||
| internal | ||
| test/integration | ||
| vendor | ||
| .envrc | ||
| .gitignore | ||
| .golangci.yaml | ||
| flake.lock | ||
| flake.nix | ||
| go.mod | ||
| go.sum | ||
| grafana.png | ||
| main.go | ||
| README.md | ||
| Taskfile.yml | ||
| vm.png | ||
caddy-log-exporter 📈🙈🙉🙊
Uses the caddy json log and exports metrics from parsing them for prometheus or victoriametrics.
Why
I use the wonderful caddy server just everywhere. There are two things that i discovered. For once there is still the thing that the caddy metrics doesnt add the host as label. There are some github issues about it and im sure that this feature will be added at one point. until now its a problem if you have multiple domains behind a caddy instance.
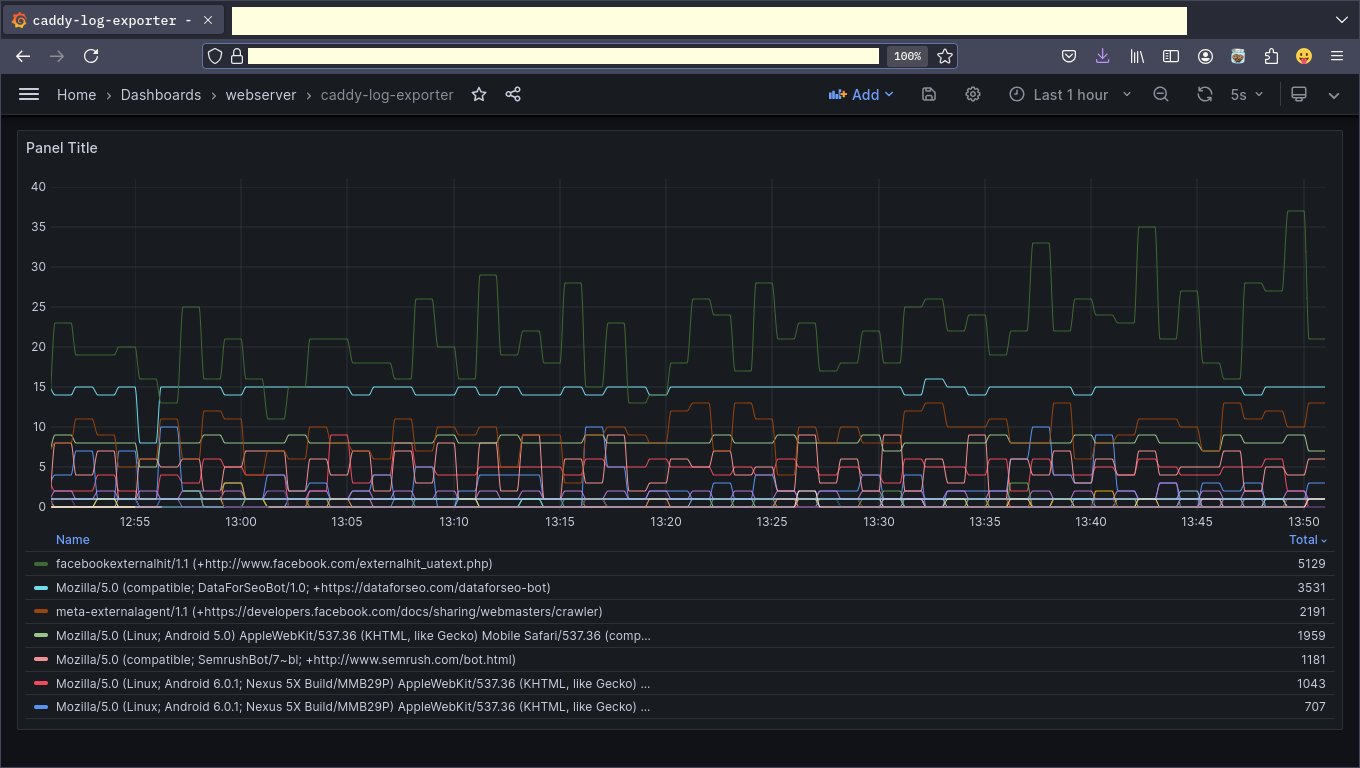
The other point is: i run a little gitea instance for some little projects on a small vserver from hetzner. some weeks ago i got prometheus alerts for cpu and memory exhaustion. i checked logs and everything and found out that i got a victim of this stupid fucked up ai craweler shit. so i start to check my caddy logs if i discover high load on my server and add the user agents to my Caddyfile. i thought it would be nice to find a top list of scraper bots that gets by my caddy server. so this exporter also adds the user agents as prometheus labels.
Here metrics after running the exporter for a few minutes:
Here in grafana:
Happily, all the stuff we need is available through the standard json logs 🥳🎉, we tail them and create metrics out of them.
Installation
Grab the latest docker image from here.
Images are available for x86_64-linux and aarch64-linux.
Usage
docker run -v /var/log/caddy:/var/log/caddy -e CADDY_LOG_EXPORTER_LOG_FILES=/var/log/caddy/caddy.log ghcr.io/xsteadfastx/caddy-log-exporter:0.1.0-rc6
Caddyfile
Enabling the json log to file.
log {
    format json
    output file /var/log/caddy/caddy.log
}
Scraping
- job_name: caddy-log-exporter
  scheme: http
  static_configs:
    - targets:
        - "caddy-log-exporter.tld:2112"
Bonus: Blocking AI bots in caddy
git.foo.tld {
    @badbots {
        header User-Agent *AhrefsBot*
        header User-Agent *Amazonbot*
        header User-Agent *Barkrowler*
        header User-Agent *Bytespider*
        header User-Agent *DataForSeoBot*
        header User-Agent *ImagesiftBot*
        header User-Agent *MJ12bot*
        header User-Agent *PetalBot*
        header User-Agent *SemrushBot*
        header User-Agent *facebookexternalhit*
        header User-Agent *meta-externalagent*
    }

    abort @badbots

    cache
    reverse_proxy gitea:3000
}
Configuration
There are some config values we can set through environment variables.
CADDY_LOG_EXPORTER_LOG_FILES: Comma seperated paths with log filesCADDY_LOG_EXPORTER_ADDR: defaults to:2112

